
Modeling Friction, Alignment, Capability, and Trust (F.A.C.T)
The success of a project is determined by the value it creates. Most AI initiatives distinguish themselves from conventional technology projects by their profound impact on decision-making, organizational culture, trust, operational processes, and customer engagement. Traditional execution levers still matter, but in AI implementations, the risks and sensitivities are amplified because AI intersects with human judgment and public trust at a speed and scale we’ve never experienced.
AI is no longer optional. For leaders, the real challenge is not whether to invest but how to turn investments into measurable, scalable value. Too many organizations remain locked in a “Perpetual Pilot Factory” state, launching proof-of-concepts that never deliver lasting business impact.
To help break this cycle, AI success must be diagnosed and measured with discipline – not vague aspirations. This is why we introduce “The Formula for AI Success – The F.A.C.T Model”, a practical framework that attempts to quantify the health of AI initiatives and highlights exactly where to focus for improvement.
This framework evaluates enterprise-scale AI initiatives (programs/projects/platforms) and is not intended for personal, one-off productivity gains achieved using AI utilities or tools.
The Equation (Raw Value):
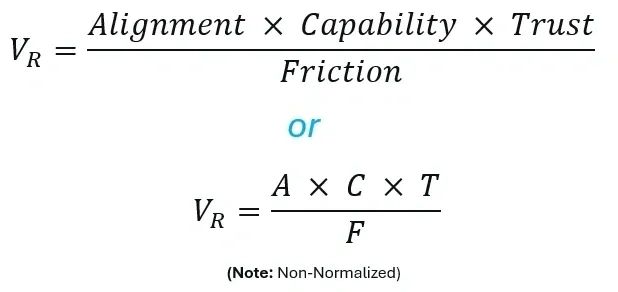
While this is a “Raw Value” and non-normalized, it is foundational. The model focuses on four universal yet key variables for an AI program’s success. Each variable is assessed for consistency so initiatives can be compared over time.
The F.A.C.T Variables
Alignment (The Why): Initiatives must be tethered to measurable KPIs and have clear ownership. Misalignment results in significant wasted investment, as models can appear functionally successful yet yield minimal business value.
Ways to Measure
- % of AI projects tied to business KPIs
- Adoption rate of AI in everyday work
- Clarity and priority of AI roadmap
Scale (0–100): 40% KPI-tie, 30% culture/adoption, 30% roadmap clarity.
Capability (The How): Effective deployment requires an integrated ecosystem of talent, production-grade data, MLOps practices, and reliable user experience. Inadequate capability consistently leads to stalled pilots, whereas full capability enables scalable value.
Ways to Measure
- % of workforce with AI/data training
- Maturity of infrastructure and pipelines
- Time to move from pilot to production
- % of models fully integrated into business workflows
Scale (0–100): 25% talent, 25% data/tech, 25% speed to prod, 25% workflow
integration.
Trust (The Belief): User adoption hinges on whether the system is seen as fair, safe, and reliable. Without trust, even technically accurate AI will be rejected over fears of bias or lack of transparency.
Ways to Measure
- Presence of ethical reviews and bias checks
- Monitoring and compliance processes
- End-user satisfaction and adoption rates
Scale (0–100): 34% responsibility/ethics, 33% governance/monitoring, 33%
stakeholder buy-in.
Friction (The Drag Factor): External hype, internal process friction, and anxiety around vendors’ / compliance slow progress, creating costly diversions and perpetuating a state of unfinished pilot projects.
Ways to Measure
- % of the budget tied up in stalled pilots
- Projects launched without adoption metrics
- Is leadership communicating outcomes in terms of impact or just activity?
Scale (0–100): Waste, hype, and drag – 50% ROI gap %, 50% Waste %.
ROI gap% = how far the delivered ROI fell short of the promised
Waste % = budget on stalled pilots/shelf ware/unused models
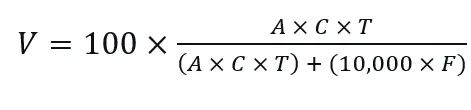
Normalized Value Index:
We should normalize the “Raw Value” for clarity and comparability, as it is not on a 0-100 scale. Therefore, the normalized V can be stated as:
Putting the formula into Practice
1. Company A – The Struggler
- A = 30 (poor alignment)
- C = 85 (strong technical team)
- T = 60 (moderate trust)
- F = 80 (high waste and hype)
- V =

Diagnosis: Stop misaligned projects immediately. Prioritize focus and operational discipline.
2. Company B – The Value-Creator
- A = 80 (aligned with business goals)
- C = 70 (solid execution)
- T = 85 (trusted AI)
- F = 20 (lean operations)
- V =

Diagnosis: Stay the course, optimize incrementally, and maintain discipline.
Interpret & Act
Once the V is computed, use the following score bands to guide further actions:
Score bands for Value (V)
- V < 40 — Underperforming – Friction dominates; stop/triage, refocus on KPI‑tied use cases.
- V 40–60 — Progressing – Reduce Friction (kill shelf ware, cap pilots), strengthen adoption.
- V 60–80 — Target Zone – Scale what works; improve reliability/UX; tighten governance.
- V 80–100 — Excellence – Replicate playbooks; expand platform/reuse; maintain discipline.
Fast Levers
- Cut Friction (F): Kill or merge stalled pilots; reallocate to 2–3 proven use cases.
- Lift A: tie each use case to one KPI/owner; prune the backlog quarterly.
- Lift C: unblock prod paths; automate pipelines; enforce MLOps / SLOs.
- Lift T: add bias checks, monitoring SLAs, training & change management.
Limitations
While this formula is practical, we advise leaders to treat this as a compass, not a calculator. Nevertheless, the following are key limitations and considerations.
Subjective scoring: Inputs like “culture” or “buy-in” require judgment and may vary across evaluators.
Context blind: Industry, regulation, and external pressures aren’t factored in.
Static snapshot: A single score captures a moment; value creation requires continuous tracking over time.
Overemphasis on penalties: Moving Friction to the denominator makes inefficiency highly punitive. This reflects operational reality, but this also emphasizes the fact that leaders must balance discipline with experimentation.
Not a silver bullet: The framework highlights focus areas but doesn’t replace detailed strategy or execution planning.
Poor Fit for the following: This framework is a poor fit or requires tweaking for the following: R&D focus, Long-term science, concept stage ventures, safety-critical and heavily regulated (i.e., medical devices), societal outcomes (Vs ROI), and creative/exploratory innovation.
Final Thought on the Equation
Multiplication in the numerator makes the value drivers (A, C, T) complementary and bottleneck-sensitive. If any of Alignment (A), Capability (C), or Trust (T) is weak, the product drops in proportion, matching how real-world AI programs fail or succeed. For example, adding the variables would falsely imply that we can offset zero Trust with more Engineering. Division by Friction (F) converts organizational drag into a measurable, scale-consistent penalty, keeping the score empirically grounded and comparable across teams and time.